essex-morris linear city
proposal for a new jersey east-west polycentric transit corridor through midtown manhattan
I.
Abstract
II.
concept
III.
History of Polycentric Linear City
VI.
transportation planning in metropolitan New
york
VII.
Transit technologies and engineering design
At-grade grade-separated automated feeder system
VIII.
Project Players and Financing
Possible organizational structures
IX.
Capital and Operating Costs
Feeder systems and land developement costs
X.
References
The following is a proposal for a highly integrated transport/real-estate development running east-west through Midtown Manhattan.
Its conceptual basis is largely derived from the “Polycentric Linear City”, a prototype for a transit-based human settlement developed by the author at www.linearcity.org/).
Legal issues for
public-private transit-oriented corridor developments are discussed at http://www.linearcity.org/rufo/Lyna-final01.htm.
Aerial photos of existing activity centers along I-280 can be found at http://www.linearcity.org/new_web/nj-snapshots.html.
I highly recommend viewing graphics and a computer animation for Morris-Essex Linear City at http://www.linearcity.org/new_web/nj-plc-graphics.html .
The plan is shaped around a transit-based intermodal transportation network that would utilize existing highway rights-of-way and rail tracks, as well as new tunneling to link Morris-Essex commuter rail to most NYC subway lines, Grand Central Station and the planned 2nd Avenue subway.
Because of the complexity of this endeavor I will ignore some institutional problems in interstate planning, track and station compatibilities, and issues regarding Midtown intermodal exchanges. Also, because of time constraints and failure to acquire the necessary data from NY public agencies, this paper will only focus on the New Jersey side of the plan.
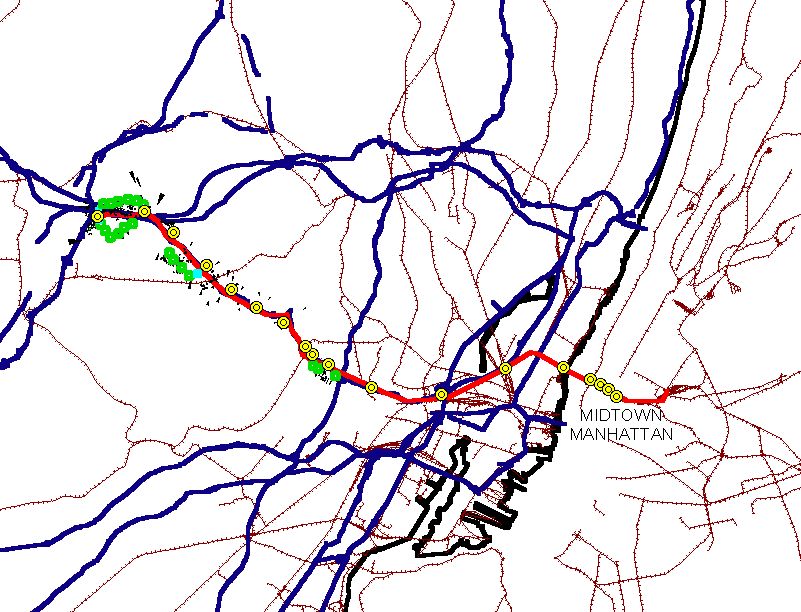
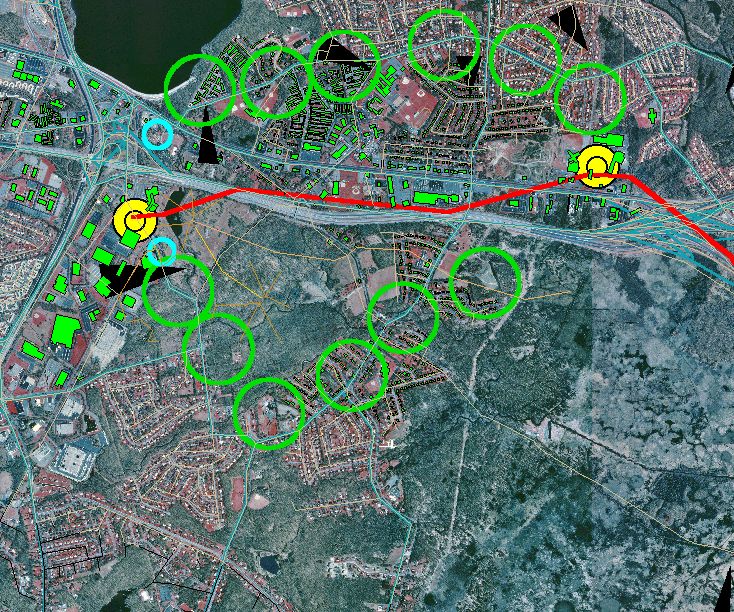
Figure 1: Auto-free Station areas (yellow, “Key Nodes”) of the Morris-Essex Rail Express. At the intersection of I-280, I-80 and I-287, these station reinforce existing commercial activity centers (red buildings). Notice the inter-station feeder route (pink), the partly-auto-restricted residential station areas (green, “Residential Nodes”) and the remote parking facilities (cyan, “Office Nodes”).
The objective of this plan is to apply the typical backbone function of a north-south New York subway line to modern New Jersey suburban neighborhoods and current transit technologies.
Urban areas served by these subways have relied on elevators to offer their riders large amounts of destinations, by exploiting them as feeder/distributor. The function of the elevators has been to multiply manifolds the amounts of square footage of useful urban space reachable by the subway line within a given time. These areas, through the transit/elevator combination, are highly accessible to/from services, entertainment, people and most “urban activities”, with the notable exception of parks. They enjoy a freedom to participate in desired activities higher then auto-based urban areas, without even owning a car.
This development concept has worked well in many major metropolises throughout the world. Today, however, transit-based planning is hard-pressed to compete with suburban development patterns, as well as with the decreasing costs of auto mobility and the decentralization of jobs.
The transit corridor concept needs to update itself by adapting to changed urban patterns and housing expectations. It needs to seize the opportunities provided by intermodal synergies and new transit technologies.
In the concept I here propose the role of elevators is replaced by high-frequency automated feeder/distributor transit systems.
By re-aligning the accessibility of elevators in an horizontal plane and maintaining their automatic operation and frequent service, much larger areas can be reached with very high accessibility. This provides the opportunity to create transit-reliant car-less low and middle density neighborhoods focused around feeder stations.
 |
 |
| SKETCH OF ROUTE ALIGNMENT | DETAIL OF MAINLINE STATION TRANSIT/LAND DEVELOPMENTS |
Since its Greek and Roman origins, cities of the Western civilization have been shaped by the natural symbiosis of transportation nodes and urban public place. Public places and plazas derived their function and significance, if not their vitality and dynamism, from the large number of people and goods that converged and diverged into it: each node was a place and vice versa. These nodes/places were major means of communication and interaction (formal and informal) among people; they acted as news/information gathering, entertainment, and key to the expansion and evolutions of a social conscience.
Since the advent of the automobile as major mode of transportation, however, it has been increasingly difficult, if not impossible, for a urban space to function as both node and a place.
Given the preponderant reliance on foot transportation, ancient cities developed around radial/gravitational forces centered in their cores. These radial forces were partly funneled in grid-like structure to further public and institutional goals, such as navigability, order, security, monumentality, efficient land utilization, and so on.
In a few cases, mostly because of harsh topographical constraints, Greeks and Roman developed cities along a single main axis and perpendicular cross streets.
In even more rare cases, such as imperial Rome, nodes/places (or squares) and links/places (or streets) became so congested because of intense private vehicular use, mostly freight carts.
This early pressures on the capacity of nodes/places were dealt with, through imperial injunctions, by restricting certain vehicles to limited hours and days of the week.
In this century, these escalating capacity pressures on nodes/places have progressively redesigned nodes to accommodate huge vehicular flows, giving birth to modern arterial intersections and highway interchanges. Such improvements to their node function became increasingly incompatible with their place functions: the parking needs, the size of roadways and their combined environmental impact made any place function impossible.
Howard, in England, and Arturo Soria, in Spain, developed the concept of linear polycentric city at the beginning of the century.
Howard developed a first regional plan consisting of multiple largely-independent urban centers. This polycentric structure consisted of a constellation of garden cities linked by a linear circumferential rail system; at their center was a larger garden city, served by radial rail lines. In his plan, the rail system was designed to loop around the boundaries of the garden cities, and immediately surrounded by light manufacturing industries. The external alignment of the rail system was necessary, given the huge noise and pollution generated by rail systems of the time.
Soria’s plan consisted of multiple lines of express and local streetcar line, which served a stratified band of real estate development stretching along its sides. Given the speed of streetcars at the time (most were still horse-draw), stops could have flexible location and be very close to each other; this, in turn, resulted in a plan for clustering of developments along the entire alignment, rather than around the transit stops.
Le Corbusier, in his late years, suggested the design of linear conurbations stretching across Europe from east to west along integrated transportation corridors. His plan for Rio de Janeiro contemplated a single integrated transportation, residential and commercial structure connecting the city across its complex topographical contours.
More recently, Peter Hall, the famous urban planning academician suggested the implementation of hierarchical transit networks along Europe’s high-speed rail lines. In a lecture in The Hague, Holland, in 1997: “…So we should base a new settlement strategy on this system. The key would be to link the regional TGV at key stations to local distributor transit systems, which might be light rail but might equally well be guided busway such as they have in Adelaide and Essen and now in Leeds, or unguided busway as in Ottawa. These systems would have a strong linear form, which might be parallel to the regional TGV or might run at angles away from it; one useful form would connect two TGV stations by an indirect route”.
“Tentative” transit-based polycentric linear corridors have been built in Singapore, Copenhagen, Stockholm, and Tokyo.
Most subways in congested world metropolis act as primary mode of transportation for many of their citizens. A majority these residents get by elevator and short walks to subway stations and, from there, to a wealth of destinations. These, however, comes at the price of extremely high densities and congestion.
In a Polycentric Linear City, instead, low and medium densities can be supported by a transit-based network substituting vertical elevators with horizontal ones (Warren, 1998): such as automated people movers and automated guided busways.
Just two weeks ago, on November 6th, the Bukit Panjang, a new fully automated feeder system to the North East heavy rail line, was inaugurated in Singapore. The new system, just three years after being proposed, was designed to provide main basic transportation to two rapidly expanding metropolitan areas, Bukit Panjang, Choa Chu Kang and Yew Tee. The system will provide internal and inter-community circulation, as well as linking them to Singapore metropolitan heavy rail network.
This is one of several fully-automated systems that will feed into Singapore mass transit network by 2004: two new fully automated systems will be completed in 2002 and 2004 will link parts of Sengkang and Pungool to the new North East Line.
A pre-construction public exhibition and local residents feedback through construction have influenced names of stations, color of trains, and architectural designs like the shape of roofs (REF). The depot and a main station of the new system have been integrated into the Ten Mile Junction shopping center comprising two stories of retail shops, restaurants, a supermarket and a food court.
For the purpose of this study the site selection was limited to the New York/New Jersey area for the ready access to geographic data, reports and regional planning agencies.
Several criteria were considered in the selection of an appropriate alignment for the implementation of a Polycentric Linear City in New Jersey:
n
Existing clusters of commercial and service activities at Key Node sites,
especially at ends of lines.
n High projected demographic growth in the region and/or potential for growth within study area.
n Mostly low and middle income residents, preferably immigrants with inclination toward public space and mass transport.
n Linearity of existing natural geographic boundaries and/or existing regional development (such as along the coast of South Florida).
n High Regional Land Values and/or scarcity of developable land.
n Flat or highly mountainous site area to maximize respectively bicycling or transit.
n Proximity or adjacency to valuable environmental features (such as park space, seacoast, riverside, etc.).
n Existing and available rights-of way segments: operating rail, abandoned rail, and highway.
n Proximity of office nodes to highway exits and interchanges.
n Existence, within 0.5-1 mile from the alignment of medium or high-density residential developments or large green-field sites.
The mainline system starts from the middle of Morris County at the interchange of Highway 280 with I-80 and I-287, follows I-280 until its intersection with Morris-Essex commuter rail line track and follows the rail tracks to Seacaucus Transfer station. At this point, NJ rail lines converge to Lincoln Tunnel. Here, two new dedicated tracks, a new tunnel is built and a new east-west underground segment is built along 42nd street to connect to Grand-Central Station and eventually connect to one of Long Island rail lines. A dedicated track is needed to accommodate a frequency of 40-60 trains per hour.
Between Seacaucus Transfer and the Morris County terminal the mainline rail system will run above ground following shortly the existing rail tracks and then along I-280 rights-of-way. The alignment will come away from the highway to connect to the centers of existing activity centers, shopping centers or office parks at highway interchanges by means of intermodal stations. Slower speed when decelerating and accelerating between stations can be used to increase the radius of curvature and therefore allow the location of stations away from polluted and noisy highway interchanges.
At these stations, high-performance (1-2 minutes frequencies) feeder transit systems will be integrated in a seamless transfer facility to provide simultaneously:
· Quick access to/from a remote parking facility for the activity center.
· Quick access to/from a number of residential neighborhoods.
· Locational advantage for a transformation of existing surface parking in activity centers into more commercial, entertainment and park space.(These area often covers 70-80% of the activity center area).
The regional coordination of transportation planning, not to mention land-use, has been a problem because of state rivalries and for the sheer number of agencies involved. No single regional authority or MPO exists with the power to enforce regional transportation goals.
Furthermore, regional transportation and land-use are handled by almost-independent agencies that do not coordinate their plans, let alone integrate them. In fact, land use planning is largely determined by local governments to maximize local benefits, while disregarding any regional impacts.
Several public and private entities are responsible for regional transportation planning in the New York metropolitan area.
The following are the main agencies, listed roughly by level of influence:
- NY Metropolitan Transportation Authority (MTA).
- NY Metropolitan Transportation Council (NYMTC).
- NJ Transportation Planning Authority (NJTPA).
- The Regional Plan Association (RPA).
- Port Authority of NY & NJ.
Other agencies, through policy making, and managerial choices have large influence on which projects are financed, or even considered:
- State of NY
- State of NJ
- NY commuter rail agencies
- NJ Transit
- State of Connecticut
Salient information of publications by the main regional planning agencies and MPOs is reported below:
NYMTC. It is the federally mandated MPO for New York City, Long Island and the Hudson Valley. Data on the number of incoming commuters to Manhattan show great disparity (opportuinity?) for New Jersey: 148,000 from Brooklyn, 136,000 from Queens, 176,000 from north of 60th Street, and only 81,000 from all New Jersey counties. Modal split is similar from all areas: 88% use transit to get to Manhattan.
Port Authority of NY-NJ. The authority was created in 1970 through an agreement between the two states and private interests.
Real Estate business in New York is 13.9 billion $ annually, with a rate of growth of 18.6% last year. Data from the path system shows that it brings 170.000 riders into Manhattan everyday; this compared to the 30,000 and 20,000 carried by the North East corridor and Morris-Essex lines, the busiest NJ commuter lines. The few miles of path tracks carry more people than hundreds of commuter rail tracks around NJ.
More than 5 million residential units, new and existing, are sold each year in NY metro. The total commercial/industrial real estate investment is B$847/year.
NJTPA: Its is the federally mandated MPO for the New Jersey side of the New York metro region. Currently, 10% (or 270,000) trips by Northern NJ residents are to New York are. Of these, 70% are by transit. Reverse trips to New Jersey account for only 74,000. The transit modal split to Manhattan has decline slightly from 10% to 9% between 1980 and 1990.
Population in Northern NJ grew
only by 204,000 in the 1980-1990 period, and 75% of that in Middlesex and Ocean
counties. The largest decline was seen in urbanized Essex.
Local elected officials hold 15 of 20 seats in NJTPA board. 50% of the funding for NJTPA is from federal sources. Following TEA-21 requirements, 18 corridors were identified as basic aggregative planning contexts. NJTPA prepared a 2000-2002 transportation financial plan than expects 940M$ in federal and 785M& in state funds. Of these 900M$ are allocated to transit and 700M$ to highway projects.
Since TEA-21 federal funds for NJTPA projects has increased from 680M$ to 940M$.
Among major projects under
development: the Seacaucus transfer will cost 448M$, and the Hudson-Bergen
Light rail line, for an expected 35,000 daily riders, will cost 1.6B$.
RPA: The are a private non-profit organization funded by major NY employers whose goal is to improve the life of NY metro citizens. Following are some of their recommendations:
- MTA needs to accelerate the shift to communication-based train controls because they are safer, reliable and allow for high levels of services. Currently, Lexington avenue subway runs at 126% of its capacity.
- The Metrolink Proposal. Only 25 miles of new ROW(2%). Tunnel boring would be used for new tunnel under 2nd avenue. Seattle has just invested 4B$ in a new rapid transit system. Paris Meteor, a fully automated high-capacity rapid transit system, has just opened in Paris. New York has made no major investments in transportation infrastructure.
-
New rail capacity should be build from New Jersey. 1/3
of all incomes earned in NY goes to commuter: it means NY-NJ economies are
linked. 2 million people in NY metro live in poverty, 1.25 immigrants are
expected in next 10 years.
- NY is only below Los Angeles for the number of days in with air quality is below national standards. By 1980, the majority of NY metro people do not live in urban area.
- Regional Express Rail Proposal (Rx). It is an evolution of Metrolink proposal. It, among other things, suggests “direct access from New York to the East Side and Lower Manhattan” and “through service from NJ to Connecticut and Long Island”. NY has 20 M people and 2,000 units of government that are almost all funded by property taxes. It is recommended that new regional coalition are formed.
- The total cost of RPA regional proposals for the next 25 years is 75B$. Given that the gross regional product is about 800B$, 40B$ would come from a 10 cents gasoline tax, 20B$ from the projected economic growth (in the form of current taxes). The transportation component of the plan would cost 47B$ over 25 years.
- MTA recently approved a three-mile segment of the 2nd avenue subway, which does nothing to improve the outlooks for NY regional transportation.
mainline
Many fixed guideway transit technologies could be selected for the mainline system.
However, in order to achieve the stated planning objectives, it should fit the following performance requirements:
· It generates very low noise and vibration levels, especially at low speeds, to be able to integrate within commercial/residential building structures.
· It must be able to operate in very small train sets to maintain 1-2 minute frequencies at off-peak hours.
· It’s interior and exterior design should be of considerably high standards, given the demographics characteristics of potential target clients.
Automation of control and operation are not necessary, but they could bring many additional benefits, including:
· Savings in vehicle operating staff.
· Increased safety, especially with the use of platform doors.
· Large increase in frequency of service at peak hours by reducing minimum headways.
· Smoother acceleration and deceleration.
· Render night freight operations economically viable.
Examples might be WMTA subway in Washington D.C., Mexico City subway and the new Meteor systems in Paris. All of these provide smooth quiet operation through rubber tire suspension and traction.
Different type of vehicles might be operated as part of the same train-sets: commuter-like interiors might accommodate long-range commuters and subway-like interiors cater to short-range riders.
Guideway and stations should be designed to accommodate double-floor vehicles at some time in the future.
feeder
At-grade grade-separated automated feeder system
Currently a large number of express busways, guided busways and light rails operate at-grade and partly-grade-separated. They run at the same level of road traffic, but some physical barrier separates their lane, except at intersections.
These systems operate on exclusive lanes, which are often physically separated from vehicular and pedestrian traffic. Intersections for those systems are designed to maximize safety and to allow fully preempted crossing of transit vehicles at operating speed.
The design of these intersections presents a greater challenge than regular intersections. Bus vehicles have limited maneuvering space to avoid collisions. Light rail vehicles are unable to swivel around obstacles and have slow deceleration time in case of emergency.
The following are some of the dangers of at-grade transit, as identified by FIU “At-Grade Busway Planning Guide”.
Side-aligned busways or light rail ROW can incur in the following problems:
· Pedestrian illegal crossing.
· Pedestrian jaywalk along ROW.
· Pedestrian and motorist confusion about which way the busway is approaching.
· Illegal left turns of motorists.
· Motorist make illegal turns across the busway immediately after the termination of their left turn green arrow.
· Motorists violate the right turn red arrow.
· Red time extension because of signal preemption makes motorists impatient and prompts them to violate traffic light signals.
· Complex intersection geometry causes confusion in motorists, pedestrians and bicyclists.
In the case of median-aligned busways or light rail ROW, the potential problems are:
· Lack of safe, clearly defined pedestrian crossings at stations.
· Lack of passenger waiting areas.
· Motorists violating traffic signals at perpendicular at-grade crossings try to beat busway vehicles to the intersection.
· Motorists making left turns blocking the busway ROW
· Motorist confusion between the busway signals and general traffic signals, especially left-turn signals.
Transportation engineers have implemented several techniques to minimize those risks, among those: designing better intersection geometry design, building exclusive lane separators by curbs/landscaping, installing warning signage at entrance to transit ROW segments, creating transit traffic lights with custom symbols, keeping vehicle headlights always on.
Regardless of all this, the hazards cause by these transit systems is very high. No specific national safety data exists on at-grade busway accident, but data on South Miami-Date Busway could be an indicator.
From the beginning of operations in February 1997 to December 1998, 25 accidents occurred, of which 19 accidents were classified as vehicle collisions and the remaining 6 as non-collisions with passenger injury. “Two out of the six non-collision accidents occurred when the driver was trying to avoid a vehicle crossing the busway and the other one when trying to avoid a pedestrian.”(FIU, 1998).
In Miami busway, as other at-grade transit systems, already use technologies that are typical of automated transit systems:
· Sophisticated traffic signal cycle management to reduce motorists as well as transit waiting time.
· Advanced vehicle motion detectors. Placed at 600 feet from intersections, they prompt the traffic light to turn green as transit vehicle approaches.
These facts show how at-grade busways not only offer poor service levels; they are far from safe as well.
There arises, therefore, an opportunity for a new transit system from an original combination of existing technologies: a fully-automated at-grade guided busway.
To my best knowledge, no driver-less “at-grade” transit system currently exists anywhere in the world, except Schilpol Airport parking shuttle, in Holland. However, many of the dozens of APM currently operating around the world have segments that run “at grade”. Contrary to “mixed-grade”, “at-grade” merely means that the transit system runs at the same elevation as that of its urban context, mostly pedestrian and vehicular traffic. Therefore “at-grade” systems can be provided that is fully separated from vehicles, pedestrians and traffic.
This complete separation, necessary for full guidance automation, can be accomplished by common physical barrier along the transit lane and by providing a fail-proof computer-controlled mechanical grade separation at the intersection.
This mechanical device should provide a barrier to entry in or across the transit lane when the transit vehicle is approaching the intersection. It may consist of:
- a metal fence that slides into the intersection from both sides to close access to the transit lane.
- A pair of swinging gates that simultaneously open/close the transit lane and the roadway intersection.

background
The realization of such an ambitious plan surely requires an elaborate and complex public-private financing and organizational structure.
Cities and metropolises have realized highly successful transit-based human settlements through very different, and even contradictory, public-private organizational structures (Cervero, 99). For example, in Tokyo great private conglomerates have been given freedom of building entire transit corridor developments on their own, whereas in Zurich similar success has been achieved by public agencies through numerous incremental ballot box votes.
Private real-estate enterprises have built most old trolley lines, as well as large sections of current rapid transit systems in New York and Tokyo. The new London Docklands "advanced light rail" (automated) extension has been built with real-estate developers' funds. A consortium of train and construction companies has recently acquired 250 Km of commuter rail lines in Rio de Janeiro for about 1M$/mile and has plans to invest 1B$ in service and station improvements.
Bee Line Monorail Project, in Central Florida, is composed of a consortium of private interests including large transit manufacturers; they intend to build a intercity rail system without public dollars, their profits would come from land appreciation around stations.
Colorado Intermountain Guideway Consortium is a state mandated authority which is looking to link the airport, Denver, Boulder, Aspen and several with a transit system and utilize large private financing.
Seattle Elevated Transportation Company is another guideway project which issued request for proposal from private consortiums which would even be able to partly choose alignments.
Possible organizational structures
In the US, several innovative financial tools are becoming commonplace in new transit projects around the country. Two recent documents by FTA (FTA, Innovative Transit Financing and FTA, Policy on Transit Joint Development) open up a wealth of possibilities for financial collaboration of private and public entities.
Through a review and analysis of those opportunities and of potential legal/liability issues in public-private transit development agreements I have devised the following (tentative) organizational structure.
The major players in the plan are:
· Counties along the corridor
· FTA
· Consortiums of transit/land developers
· New Jersey Transit.
These recent developments suggest that private financial involvement could
be very large.
The setting of standards, and conditions for the corridor could be coordinated by any combination of the following:
· A newly empowered MPO (as recently in Atlanta).
· A coalition of a number of municipalities.
· A new state-mandated corridor authority.
· A newly-formed corridor subsidiary of NJ Transit.
Consortiums of developers, Real Estate Investment Trusts and public-private joint development agencies could also be major players.
In an American context, a combination of federal and private investment could prove the best strategy. In fact, it would be difficult for state and federal agencies to invest such large resources in a single corridor. Concentration of large resources in a single corridor would be politically unfeasible.
The need for concurrency and spatial integration of the transit and real-estate elements of the plan suggest their financial and decision-making structures should be integrated as well.
New FTA legislation and guidelines allows the use of federal funds for almost any kind of real-estate venture that has even just “functional” relationship to the transit system. Properties detached from station areas can be acquired, sold and/or leased and the profit kept by the agency as ordinary program revenue. These properties can be as far as 1500 feet from the station area. New guidelines allow and encourage corridor wide joint-development efforts by allowing the agency to cross-subsidize investments between station areas within the system, i.e. a money-loosing investment in station will be accepted if it provides higher benefits in another.
FTA required annual financial report for US transit agencies shows innumerable ways in which capital and operating costs of transit systems are financed.
These recent events and legislations suggest planning, financing, construction and operation of transit and real estate elements could each be handled by a number of public or private entities.
Many public and private entities have to commit significant resources and take serious financial responsibilities.
The feasibility of this plan rests on the assumption (in the absence of a detailed economic study) that its projected total net benefits are large for each of the players. The benefits should be so high as to compensate the players for the risks of a complex plan, and to compensate for the inability of charging certain benefactors for their gains. A successful implementation requires a legal as well as financial commitment by various public and private entities. Obviously, these entities will only commit to the project if they have a legal protection against the failure of other entities to fulfill their obligations under the agreed conditions and time frames.
It is, therefore, essential that the chosen financial scheme capture most of the benefits provided by the system. This is rarely the case. In fact, the large majority of those benefits, (when there are any) are captured by the market value of a number of land parcels around its nodes through increased accessibility. Traditionally, publicly financed auto and transit infrastructures recover a small fraction, if any of those added values, therefore providing a windfall of undue profits to a few land/property owners.
Let’s look at how accessibility (and value) might change for properties along the Morris Essex Linear City. Let’s assume a typical residential land parcel located at one-minute walk time from a auto-free feeder station: this parcel would have a 20-25 minutes Midtown Manhattan and 4-5 north-south Manhattan subway lines, plus a 4 minute access to two large commercial/service/social centers (at the mainline node). Such level of transit intermodal accessibility could permit this household to dispose of the costs of owning and operating all or most their cars and parking spaces, while maintaining or improving their “freedom of movement”. Let’s assume the projected property value increase is of 30%.
This value increase embeds the benefits of the transit-corridor development and should be captured to pay for the financing of the transit system.
Given the character of the American consumer financial markets, this increase in value of their immobile assets readily converts into an increased availability of liquid assets in the form of credit from financial institutions.
How do we assess the accessibility of a specific property parcel?
Simple programming within current GIS software can measure the accessibility of a given parcel by quantifying the time and costs of reaching a certain destination through non-auto modes; or the amount of usable space that is reachable within a certain transportation time and/or cost.
Given appropriate data, these techniques can be used to quantify the increased intermodal accessibility of given parcels along a transit corridor and, therefore, to estimate the increase in property value resulting from the new transportation improvement.
Through routine computer processing, personalized maps showing parcel-specific accessibility improvements can be easily produced and printed for each parcel along a corridor. Then, these maps can be semi-automatically mailed to each property owner to gain their political support for new selective local property taxes.
Feeder System
This accurate accessibility information can be used by the local government to capture a substantial part of the increase in land value through some form of taxation. It would be ideal to capture this surplus immediately with a single tax. However, most owners would have to struggle to find such large amounts of liquid assets and it would be politically unfeasible.
Therefore, a mixture of two taxes could be used: a one-time property sales tax to be charged at the time of sale, and a yearly property tax.
The one-time real estate property tax would be based on a percentage of value appreciation directly caused by the plan transport/land-use improvement, a sort of impact fee.
The overall balance between the new taxes and the expected increased market value should appear clearly as positive one to at least most residents to generated the political momentum for the new tax and new land use changes.
These dedicated taxes will be used to partly finance the construction and operation of the feeder systems.
Other funds for the construction of the feeder system will come from the acquisition and resale of re-zoned commercial/services land parcels around the feeder stations.
The local government will issue a Request for Proposal to design-build-operate-maintain a feeder system, its station cores and provide land assembly of station areas properties
The local government will set minimum community criteria for the location and design of alignment and stations, provide funds from selective property taxes, assist in lots condemnation (if needed), set minimum service standards, set eventual high and/or low caps to transit fares, apply agreed-upon land-use changes to station areas.
The private transit developer will propose a plan for the construction and operation of a feeder ROW (mixed and/or separated), vehicle acquisition, station area land use and site design. Station area land assembly through a combination of partnering with existing owners, “transfer of property rights”, “transfer of development rights”, land acquisition, construction of basic station area circulation and utilities infrastructure, where needed. The private transit developer will provide its own financial sources.
At the end of construction, the transit developer will sell or lease station area re-assembled parcels to the highest bidder. This revenue, along with fares and local property taxes, will go to pay the capital debt, the operating costs and generate profits for the shareholders of the transit/land development company.
The decision of how much of the system costs should be recuperated from fares or local property taxes should be a local decision. By a locally set fare structure they can ensure the preservation of security and privacy. This might be the case for affluent neighborhoods worried that transit might bring undesirable strangers into the neighborhood.
In the case of less affluent neighborhoods, these fears may be less pronounced, and fares should be low so that anyone can afford them and local businesses can thrive.
Each feeder system operate in a close or semi-close network allowing for different companies to experiment with different competing transit technologies. These could intersect one or more mainline stations, or consist of loops around a single mainline station. Guideway and controls technical standards may be established on a corridor-wide basis to permit the sharing of certain guideway segments by different feeder systems.
In some cases, feeder systems could stretch along many stations, taking advantage of economies of scale and the reduced need for transfers during intra-feeder trips.
Mainline
The main-line transit system, instead, needs much larger capital investments.
The transit element of the mainline system needs two semi-dedicated tracks to connect from Essex and Morris counties to Penn and Central Station.
A new tunnel needs to be built from Seacaucus transfer station to Midtown Manhattan, new slots created in busy Penn and Central Stations.
The projection of its costs is complex to estimate. One estimate by a former NJ Transit high official put it at 1.5 $B. This tunnel, however, would in part accommodate peak hour demand from other NJ Transit lines as well as Amtrak. (The new automation controls installed in the fully-automated high-capacity Meteor system in Paris, currently operate at 85 seconds headways and integrating manually operated vehicles from other lines).
Final costs could be of the order of 2-3 $BM. Those costs are ordinary for metropolitan subway systems.
From Seacaucus Transfer, the system would run shortly on the Morris-Essex line tracks and then follow highway 280 until a junction of several highways in the middle of Morris County.
mainline system
“Given the statistically limited number of fixed guideway systems developed over the past twenty years, the construction of capital cost indices using actual, as-built unit cost data is infeasible”. This conclusion by the extensive FTA Transit Capital Cost Index Study shows the futility of trying to estimate capital costs for a line-haul guideway system without detailed custom analysis.
Also, the wide range of route lengths and configurations makes the traditional cost measurement on a per-mile basis impractical.
Review of annual FTA-required reports by US transit agencies show several interesting things.
In 1997, the total capital expenditures were 7.6B$, while the total operating costs were 18.9B$.
Feeder systems and land developement costs
Automated guided-busways and APM systems, though similar in technology and performance, involve different capital and operating costs.
Assuming that a typical automated feeder loop would be about three miles long and include 12 stations (spaces about ½ mile apart), then about 12 vehicles (15 including spares) would be needed to provide one-minute service at peak time. The price for these vehicles can vary widely depending to what extent they can be based on existing small bus technology. Small guided buses could cost as little as 100-150K$. In Leeds and Ipswich, conventional buses were equipped for curb-based mechanical guidance for $4,000 per vehicle.
One other expense would be retrofitting roads with physically-separated transit lanes, and roadway intersections with automated mechanical barriers for controlling the transit lane from auto or pedestrian crossing.
In the case of APMs, “System costs are only part of the picture…and only about one-third with loop-type systems. The remainder of capital expenses is in fixed facilities – in the structure of guideway, station and foundations – that is, the APM interface with its urban settings. And this is always site specific.” (Warren, 1999) (Elms & Lindsey, 1999).
This data on the actual costs of APMs, by a senior planner at the largest automated-transportation consultant firm in the world, suggests that a full coordination of the transit and urban planning, financing and construction management can dramatically reduce the costs of installation.
It also implies that cost estimation becomes more complex and intertwined with the costs of the development of the surrounding buildings and spaces.
ROW could mostly use the converted center lanes of existing arterial roads, which could be separated by shrubs to permit automated operation. This way, the construction of rights of way, and its visual impact, would be minimized.
Station area land acquisition, basic utility and circulation infrastructure should be built concurrently by the same developer for the natural synergies among those services (At the time of street cars in the US, most were developed by Electric Utility companies as a way to reach their customers, charge fares and gain on land appreciation). The station area should comprise about 200-400 feet around the station. Costs for these land improvements could vary between 3 and 10M$ per station area.
The costs for the transit element could be as little as 10-15 $M and the real estate/station element as little as 30$M.
· Shen D., Elbadrawi H.,Zhao F. and Ospina D..Lehman Center for Transportation Research At-grade Busway Planning Guide. Florida International University, 1998.
· Bertolini L. and Spit T., Cities on Rails. Routeledge, 1998.
· Ben-Akiva, Moshe and Bowman L. John. Activity Based Travel Forecasting.Activity-based Travel Forecasting Conference.Wash., DC: DOT.
· Ben-Akiva, Moshe and Bowman L. John. The day activity Schedule approach to travel demand analysis. Wash., DC: TRB annual meeting 1998.
· Bhat R.C., and F.S. Koppelmann. A retrospective and Prospective Survey of Time-use Research. Northwestern University. (#990830).
· Bhat R.C., J.P. Carini and R. Misra. On modeling the Generation and Organization of Household Activity Stops. TRB Annual Meeting, 1999.
· Cervero, Robert. The Transit Metropolis. Washington, DC: Island Press, 1998.
· Shen D., Huang J. and Zhao Fang. Automated People Mover Applications: a worldwide review. Washington, DC. : National Urban Transit Institute.
· Warren, Roxanne. The urban oasis. McGraw Hill, 1997
· Miller, J. Harvey. Measuring space-time accessibility benefits within transportation networks: basic theory and computational procedures. Geographical Analysis, April 1999.
· Zhang M., Q. Shen and J. Susssman. Strategies to improve job accessibility- a case study of Tren Urbano in San Juan Metropolitan Region. 1998.
· Niles J. and D. Nelson. Measuring the success of Transit-oriented Development: retail market dynamics and other key determinants. APA National Planning Conference, 1999.
· Chang-Ing Hsu and Shwu-Ping Guo. Residential location choice in a n urban area with surface streets and rail transit lines. TRB Annual Meeting, 1999.
· Federal Transit Administration. Innovative Financing Techniques. Washington, 1999.
· Federal Transit Administration. Policy on Transit Joint Development. 03-14-1999. (vol. 52 number 50).